Graph databases

My second day at the Spartakiade was dedicated to the subject of graph databases.

In computing, a graph database is a database that uses graph structures for semantic queries with nodes, edges, and properties to represent and store data. A graph database is any storage system that provides index-free adjacency. This means that every element contains a direct pointer to its adjacent elements and no index lookups are necessary. General graph databases that can store any graph are distinct from specialized graph databases such as triplestores and network databases. (source: Wikipedia)

The workshop was led by Stephan (@Piratevsninja) – thank you very much! – and we used Neo4j, the most popular open source graph database. After this day of dive-in I can say I can start to create my first graph database application without asking myself all the time what the hell am I doing 🙂

Also: what is a graph database?

On a very high level we can split the databases into two types: RDBMS and NoSQL. In other words: into relational and nonrelational storages.

NoSQL databases – called by Martin Fowler Not Only SQL have the main focus on the data model and not on the relations between the data. Mostly there isn’t any relation between the entities. They can be differentiated based on the data model they use. Here some examples: Key-value storages (Redis, CouchDB, etc.), Document DBs (Lotus Notes, MongoDB, etc.), Column based DBs (Cassandra, HBase, etc.).

Relational databases (RDBMS) store the data denormalized and define the relations between the data types (also ALL the entries of one type). I don’t think I have to give examples for our plain old databases: if you can join and distinct data you are in the world of relational databases.

Graph databases combine both worlds: they are relational databases with the main focus on the relations between the data (not between the data model) – or like Stephan formulated it: they put data in the context of relationships.

Nodes and relations
Emil knows Ian (source: neo4j.com)

How you define the content ?

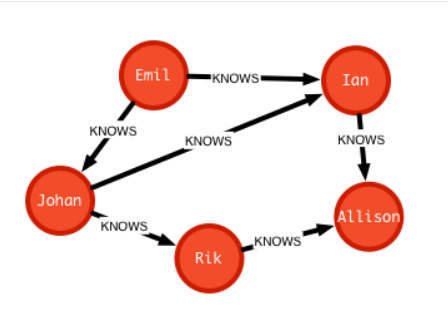
A graph database contains nodes (instances like “Emil” and “Ian”) and relations between these nodes (“knows”). One node is defined through some properties and can be grouped through labels. They often have aliases to be easier to work with them:

Emil:Person {name:"Emil", age:"20"}, Ian:Person {name:"Ian"}

One relation is defined through a name, the nodes it connects and the direction of this connection. Relations can also have properties but they should be very carefully chosen. They must describe the relation and not the nodes.

(Emil)-[:KNOWS {certainty:100}]->(Ian)

Now is clear to see what is the difference between a “plain” relational and a graph database: for the former you care always about the data. For the latter the data means nothing without the relation to some other data.

Movies and actors


Fine, I can set actors in relations. So what?

The most important point is: think around a corner. The fact that I can report that Ian knows Emil and Johann knows Emil too can be interesting but I don’t think there are any new business ideas in the domain of social connections which weren’t evaluated yet. What about the information that only 20% of the Swedish tourists who visit Germany and are between 18 and 25 do not speak German? This is surely a VERY interesting to know if you sell German dictionaries in the near of Universities…
I just invented this idea – I have no idea how many Swedish guys between 18 and 25 are speaking German 😉 – but this is what I mean with think around a corner!

What else remains to do?

After giving a good thought to the design: the relations and the connected data – like ids and oder characteristics but only if they are must-have – there are only a few things to do. Neo4j just like all the other graph databases have some kind of API to create, insert, update and query data. You only have to save the data across your application and create a UI (or use the one from Neo4j which is one of the coolest UI I ever saw) to create reports. Put this reports in front of the business analyst and you are done!

Spartakiade – Marathonlauf für Entwickler

Am Wochenende von 21-22. März hat im Berlin die vierte Spartakiade stattgefunden. Die Idee der Veranstaltung ist einfach: eine Open Space-(Un)Konferenz, die ausschließlich aus Workshops besteht.

Ich habe bisher noch nie geschafft, die Spartakiade zu besuchen. Bis jetzt. Mein Urteil: volle Punktzahl. Diese zwei Tage machen zusammen mit den anderen Open Space Events (Developer Open Space in Leipzig, Open Space Süd in Karlsruhe und Shorty Open Space, der immer spontan via Twitter organisiert wird ) die Sache rund.

Wir waren über 100 Teilnehmer, die in den 2 Tagen 19 Workshops besucht haben. Unsere Coaches genau so wie die Organisatoren sind really most valuable persons der Community, die mehr als unseren Dank verdienen: ein großer fetter Dank von mir nochmal an euch alle (ich hätte Angst, dass ich jemanden vergesse, deshalb schreibe ich hier keine Namen. Aber sie sind alle auf der Homepage der Spartakiade zu finden).

Ich meine, es ist schon großartig, dass wir die Workshops unter traumhaften Bedingungen, in den Räumlichkeiten von Immobilienscout24 haben dürften. Aber einen vollen Kofferraum Gadgets zu besorgen um das Workshop “Smart Things” vorzubereiten, oder neben der Arbeit sich in das Thema Graphdatenbanken einzuarbeiten UND die Präsentation an die 15 oder so “ausgehungerten” Entwickler vorzustellen –  nur um zwei von den Workshops zu erwähnen – , das macht man nicht mal so. Genauso wenig, wie für das Mittagessen mal 1 bis 3 Stunden im verregneten und kalten Berlin neben dem Grill auf der Straße zu stehen und für den zweiten Tag sich einen Burger-Wagen auszudenken, dann ist das schon viel viel mehr, was man normalerweise tun muss. Sowas entsteht nur durch voller Hingabe.

Ich habe hier keine Details über die Workshops, die ich besucht habe, genannt, weil sie auf jedem Fall eigene Blogposts verdienen. Ich kann nur eine Bemerkung eines Kollegen zurückgeben: “die Kosten, die durch dieses Wochenende entstanden sind, sind peanuts im Vergleich dazu, wie viel wir gelernt haben und wie viel return-of-investment aus dieser Investition entstehen wird!”

Wie gesund ist eigentlich mein Code?


software quality metric: A function whose inputs are software data and whose output is a single numerical value that can be interpreted as the degree to which software possesses a given attribute that affects its quality.

 Definition nach IEEE Standard 1061 – [Quelle: Wikipedia]

Jede Software, deren Code länger als ein paar hundert Zeilen ist, wird irgendwann den Punkt erreichen, dass man den Code auf Anhieb nicht mehr verstehen kann. Die meisten von uns schreiben Code, der älter als ein paar Monate ist und noch ganz viele Jahre erhalten bleiben soll. (Alle, die das nicht wollen, können hier aufhören zu lesen).

Das Problem, das man früher oder später bekommt, ist die Komplexität unter Kontrolle zu halten. Jeder neuer Kollege hat das Problem, unbekannten, vorhandenen Code so schnell wie möglich zu verstehen. Für beide Fälle ist es sehr hilfreich, wenn man Tools zur Hand hat, die zum Beispiel die Zusammenhänge und Abhängigkeiten visualisieren können.

Als ich bei dem Open Space Karlsruhe die Frage gestellt habe, was die .NET-Community zu diesem Zweck nutzt,war die einstimmige Antwort : NDepend.  Code Metriken sind wichtig, sie sind aber nicht allmächtig. Wenn man allerdings wissen möchte, wie gesund sein Code ist, was sich verschlechtert hat und welche Baustellen aufgeräumt wurden, dann ist NDepend das de facto Standardtool, welches benutzt wird.

Was macht das Tool eigentlich?

Um all die Features zu beschreiben, die NDepend hat, würde man sehr viel Platz und Zeit benötigen – und zum Glück ist dies gar nicht nötig: auf deren Webseite findet man alles, was man braucht: Bilder, Erklärungen, weiterführende Links.

Ich würde hier nur zwei wichtige Funktionalitäten herausheben:

  • Visualisiert

MVC-Runtime Dependency Graph
Abhängigkeiten im MVC-Runtime


Auf diesem Bild sieht man, dass man gar nichts sieht 😀

Stellt euch mal vor, ihr müsstet ab sofort an MVC weiterentwickeln. Wo würdet ihr anfangen? Ich würde hiermit beginnen und immer mehr reinzoomen.

Alle Verwender von DotNetOpenAuth.OpenId


  • Erklärt

Das coolste für mich bei NDepend ist eigentlich nicht die Tatsache, dass es mir Statistiken und Grafiken liefert, sondern, dass es sie mir Diese auch  erklärt!


Interne Abhängigkeiten von DotNetOpenAuth.OpenId


Genau so läuft es auch mit den Metriken. Ich will nicht wissen, wie diese berechnet werden – eventuell später –  aber ich will wissen, was es bedeutet, wenn ein Wert zu hoch oder zu klein ist. Und das Tool erklärt dies alles oder leitet mich gezielt dahin weiter, wo es erklärt wird. Und so, ohne es zu merken, habe ich etwas gelernt, was meine Codequalität höchstwahrscheinlich erhöhen wird. Ich kann dadurch ein besserer Programmierer werden.

Es gibt noch sehr viele Gründe, wofür man NDepend ausprobieren bzw. nutzen sollte. Spätestens, wenn ein Team sich für gemeinsame Regeln einigen möchte, sollte man die Einhaltung durch Tools wie dieses und StyleCop and co. absichern. Dadurch wird irgendwann egal, wie ungesund unserer Code heute ist, morgen wird es ihm auf jedem Fall besser gehen – und uns auch.